Cisco Webex Contact Center (WxCC) includes native reporting capabilities designed to support day-to-day operations and basic performance tracking. However, it's missing real-time agent performance, queue-level bottlenecks, and historical trend analysis.

While these built-in tools can answer common questions about agent activity, queue volumes, and multimedia interactions, they often only cover a portion of the metrics needed for strategic decision-making. Let's explore the most common gaps and how to solve them.
See how teams eliminate Webex Contact Center reporting gaps in real-time:
Explore Webex Contact Center Reporting Solutions
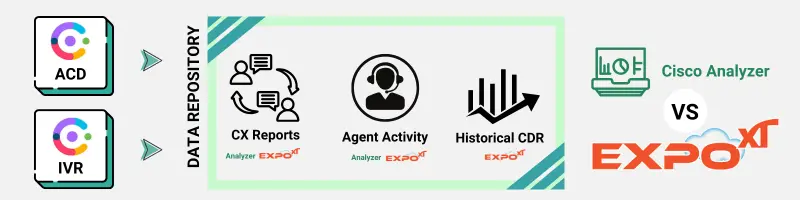
The core of WxCC reporting is the Cisco Analyzer engine, which collects interaction data from voice, chat, and email channels. Native reporting is robust for "operational visibility"—what happened today, this week, or this month.
Although Analyzer is a solid foundation, it falls short in several critical categories:
Reports typically retain detailed data for a limited period—approximately 13 months for certain types. This makes multi-year trend comparisons and seasonal insights difficult without external processing.
Native tools lack built-in predictive analytics or AI-driven insights. You cannot easily answer questions about predicted peak loads or agents likely to impact customer satisfaction.
Dashboards support basic charts but are not designed for complex visual storytelling (like heat maps or funnel visualizations) or multi-source data integration. Export formats like Excel or XML often require heavy post-processing.
While you see wait times, the system doesn't natively break down abandoned contacts by demographics or follow customer journeys across multiple interactions. It lacks context for what happens just before abandonment.
Reporting tracks general activity like login and handle time, but it does not reliably measure time allocation across multiple tasks or adjusted productivity based on complexity.
Critical voice quality indicators—packet loss, jitter, or latency—are typically outside the scope of standard WxCC reports, often residing in separate telemetry sources.
When reporting cannot support deep analysis, leaders struggle to answer strategic questions:
Establish clear operational KPIs that focus on short-term and daily performance.
Export data regularly and archive it to build your own historical datasets.
Leverage API access where deeper access to raw interaction data is required.
In some cases, combining native reports with business intelligence tools (e.g., BI systems) can bridge the visualization gap without requiring a full analytics platform.
If your center requires multi-year trend analysis, predictive modeling, or deep journey reconstruction, native reporting alone likely won't meet your needs. Advanced analysis involves external tools that ingest and normalize data over time to deliver insights for stakeholders beyond the operations team.
| Feature | Operational Reporting (Native) | Advanced Analytics (External) |
|---|---|---|
| Core Focus | "What is happening now?" | "Why is it happening?" |
| Data Retention | ~13 Months | Multi-year / Unlimited |
| AI Insights | None | Predictive / Anomaly Detection |
Webex Contact Center’s native reporting provides solid operational insights suitable for daily performance monitoring and basic analysis. However, native reporting design choices, including historical retention limits, constrained visualizations, and a lack of deep analytic modeling, mean that strategic decision support usually requires augmenting with external analysis tools. Being clear about what native reporting can do versus what it cannot do empowers technical users to choose the right approach for their analytical needs.
Yes, through dashboards for current queue depth and agent state. However, this is for supervisory monitoring, not holistic performance or benchmarked historical evaluation.
Yes, but customization is limited to predefined data fields and does not easily support complex calculations or multi-dataset joins.
Typically no. Reports focus on operational metrics like wait times; jitter and packet loss are usually found in other Webex telemetry.
If you're working with Webex Contact Center, these related articles explain the architecture, reporting limitations, and analytics strategies in more detail.
Webex Contact Center Reporting Architecture: Learn how the reporting pipeline works inside Webex Contact Center and why certain metrics are difficult to extract.
CSAT and Auto-CSAT in Webex Contact Center: Organizations attempting to measure customer satisfaction often rely on CSAT or Auto-CSAT analytics.
WebRTC Agents in Webex Contact Center:Many modern deployments use browser-based WebRTC agents, which changes how call data and session metrics are collected.
Migration Considerations: Learn how the reporting pipeline works inside Webex Contact Center and why certain metrics are difficult to extract.
Leading organizations don’t try to force Webex into something it’s not. Instead, they layer advanced analytics on top.
With Metropolis Expo XT, teams can:
Combine Webex Contact Center + Calling + CUCM data
Build real-time dashboards in Power BI
Track KPIs like AHT, FCR, and agent occupancy with precision
Eliminate manual report exports
See how teams eliminate Webex reporting gaps in real-time: Explore Webex Contact Center Reporting Solutions →