

Webex Calling provides a wealth of communication data through the cloud but extracting that data for Microsoft Power BI requires navigating modern API authentication and complex JSON structures.
Unlike legacy on-premises systems, Webex Calling utilizes a RESTful API architecture. To build an effective dashboard, you must be able to programmatically request call history, handle pagination, and flatten nested data into a star schema.
To see how Webex data fits into your broader strategy, read our Using Power BI for Unified Communications (UC): How to Build it and When to Buy It.
Unlike on-prem systems, Webex Calling integrations rely on cloud-based APIs and data pipelines rather than direct database access. Most Power BI connections to Webex Calling use REST APIs, scheduled exports, or middleware platforms that normalize the data before visualization.
This means organizations must account for authentication, rate limits, and data transformation when building Webex Calling dashboards in Power BI.
Webex Calling data is protected by OAuth2. To connect Power BI, you must first register an integration in the Webex Developer Portal:
Log in to developer.webex.com.
Create a "New App" and select Integration.
Select the scope spark:calling_cdr_read to access call history.
Secure your Client ID and Client Secret.
Power BI connects to Webex via the Web Web Data Connector. You will target the "Detailed Call History" endpoint, which provides granular information on every call leg, transfer, and redirect.
The API Endpoint: https://analytics.api.webex.com/v1/detailedCallHistory
Because Webex limits the number of records returned per request, your Power Query script must include logic to handle the link header for pagination to ensure you capture the entire day's call volume.
When the data arrives in Power BI, it will be in a nested JSON format. You must expand these records to fit a relational model. Below is the optimized schema for Webex Calling analytics.
| Object Property | Data Type | Dashboard Use Case |
|---|---|---|
startTime / endTime |
DateTime (ISO 8601) | Calculating peak hour call concurrency. |
callingNumber / calledNumber |
String (E.164) | Identifying inbound vs. outbound traffic. |
callOutcome |
String | Visualizing success vs. abandonment rates. |
direction |
String (Inbound/Outbound) | Slicing report by traffic type. |
userType |
String | Filtering by Automated Attendant vs. Real User. |
The biggest challenge with Webex data in Power BI is flattening the record. Each call record contains nested arrays for "Redirects" or "Participants."
In Power Query (M), you must use the Table.ExpandRecordColumn function to extract these details. Additionally, Webex timestamps are in UTC; you must apply a transformation to align them with your local business hours for accurate "Time of Day" reporting.
To get value out of your Webex data, use these DAX calculations:
Total Call Duration (Minutes):
Total Minutes = SUM(Webex_Calls[duration]) / 60
Average Ring Time:
Avg Ring = AVERAGE(Webex_Calls[ringDuration])
Tired of managing API tokens and flattening JSON? MetroLink automates the Webex Calling API connection, delivering a perfectly formatted, relational SQL feed directly to your Power BI desktop.
The Detailed Call History API typically allows you to retrieve data for the last 48 hours to 7 days, depending on your Webex license level.
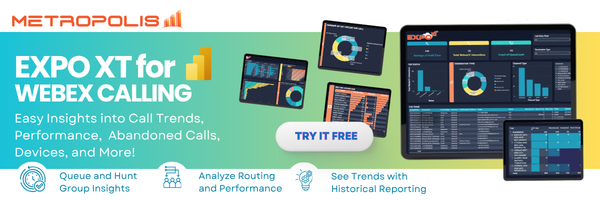
For long-term historical trends, you must use a tool like Expo XT UC Analytics for Webex to archive the data in a dedicated database.
No, this specific API is for Webex Calling. However, Power BI can combine Webex data with Teams data if you normalize both sources into a single "Unified" semantic model.
Can Power BI connect directly to Webex Calling?No, Webex Calling typically requires API access or a data connector to integrate with Power BI.
How do you automate Webex Calling data refresh in Power BI?Using scheduled API pulls, data pipelines, or a UC to Power BI connection tool, like Metropolis' MetroLink.
Why are my call counts different from the Webex Control Hub?Control Hub often aggregates multiple call "legs" into a single session. When pulling raw API data, you are seeing individual records for every segment of the call.
Proper "stitching" logic in Power BI is required to match Control Hub's summary views.
